

PROPERTY MARKET TRENDS | 1Q 2025

PROPERTY MARKET TRENDS | 1Q 2025
Residential: New condominium prices remained high in the Tokyo metropolitan area while sales were strong in the Kinki region
Offices: Favorable vacancy rates and average rents as employees increasingly returned to the office
Logistics: Demand stimulated in the Chubu, Kinki, and Fukuoka regions
Residential
The average price in Tokyo, Kanagawa, and Saitama was more than JPY 60 million. The contract rate fell due to rising prices, and a succession of contracts concluded on second-hand condominium properties drove the rental apartment market price higher.
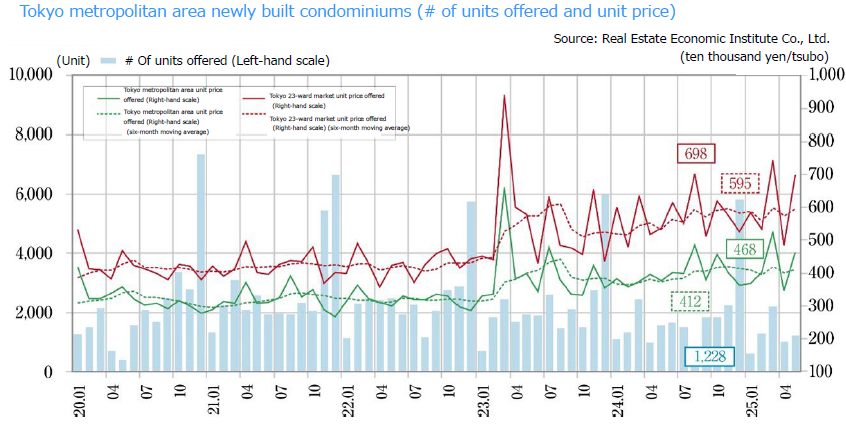
■New condo. sales in Tokyo metropolitan area
・In May 2025, there was a new supply of 1,288 units, and the average initial sales price, floor area, and unit price were JPY 93.96 million, 66.95 sqm, and JPY 4.631 million per tsubo, respectively. The month-end inventory was 5,871 units, while the contract rate in the first month of sales was 57.9%, down 8.4 ppt MoM and below 60% for the first time since January 2025.
・In the 23 wards of Tokyo, there was a new supply of 461 units, and the average initial sales price and unit price were JPY 140.49 million and JPY 4.631 million per tsubo, respectively. The share of supply was 35.8% and the contract rate in the first month of sales was 57.0%.
■New condo. sales in Kinki region
・In May 2025, there was a new supply of 1,064 units, and the average initial sales price, floor area, and unit price were JPY 58.13 million, 58.57 sqm, and JPY 3.275 million per tsubo, respectively. The month-end inventory was 2,621, while the contract rate in the first month of sales was 74.7%, down 2.3 ppt MoM and up 6.0 ppt YoY. Amid these favorable trends, the rate remained above 70% for the fifth consecutive month.
・In February and April 2025, supply in the Kinki region exceeded that in the Tokyo metropolitan area, and the contract rate remained favorable at 70% or higher. As of May, the unit price was down YoY only in Osaka Prefecture other than Osaka City while it was up 20% or more YoY in areas, including Osaka City, Hyogo Prefecture, and Nara Prefecture.
■Second-hand condo. sales in Tokyo metropolitan area
・The number of contracts made in May 2025 was 3,841, up 35.0% YoY. The average age of contracted units was 26.71 years, while contract price, floor area, and unit price were JPY 53.11 million (+9.9% YoY), 63.18 sqm (-0.3% YoY), and JPY 2.779 million per tsubo (+10.2% YoY), respectively. The unit price recorded the 61st consecutive month of increases on a YoY basis.
・ The numbers of units newly listed and in inventory were 15,636 units (+3.6% YoY) and 44,314 units (-2.8% YoY), respectively, falling on a YoY basis for the thirteenth consecutive month.
■Rental apartments in Tokyo metropolitan area
・The number of contracts made for rental apartments in Jan.–Mar. 2025 was 43,607 units (up3.4% YoY) and the 23 wards had a share of 61.6%.
・Average monthly rents by region (YoY comparison) were JPY 113,000 (down 1.7%) in the 23 wards, JPY 76,000 (down 3.7%) in other areas of Tokyo, JPY 88,000 (down 2.2%) in Yokohama/Kawasaki, JPY 78,000 (down 2.5%) in Saitama Prefecture, JPY 77,000 (down 3.7%) in Chiba Prefecture, and JPY 74,000 (flat) in Kanagawa Prefecture other than Yokohama/Kawasaki City. While rents were down by JPY 2000–3000/unit from the previous period in all areas but Kanagawa Prefecture other than Yokohama/Kawasaki City, unit rents were up 3% to 4% from the previous period.
■Market overview
・The new condominium market continues to shrink in the Tokyo metropolitan area. Properties showed a particularly pronounced decrease in the 23 wards of Tokyo as the supply broadened to areas beyond the 23 wards. Naturally, the number of contracts is increasing in the second-hand condominium market as new condominium supplies shrink, and prices rise. However, as pronounced price increases cause the average in the three central wards to rise to JPY 120 million or more for 56 sqm in a 23-year-old property, it has become increasingly likely that the number of contracts will decrease in the future as fewer prospective buyers are able to afford properties.
・In the new condominium market in the Kinki region, supplies are stable, and prices generally are at a level that first-time buyers can afford. While market prices are increasing, favorable conditions can be expected to continue for a while.
Office
Recovering numbers of in-person workers are leading to continued improvement in vacancy rates and rent increases. Supply pressure is increasing as numerous new office buildings are planned for development but chiefly in central Tokyo.
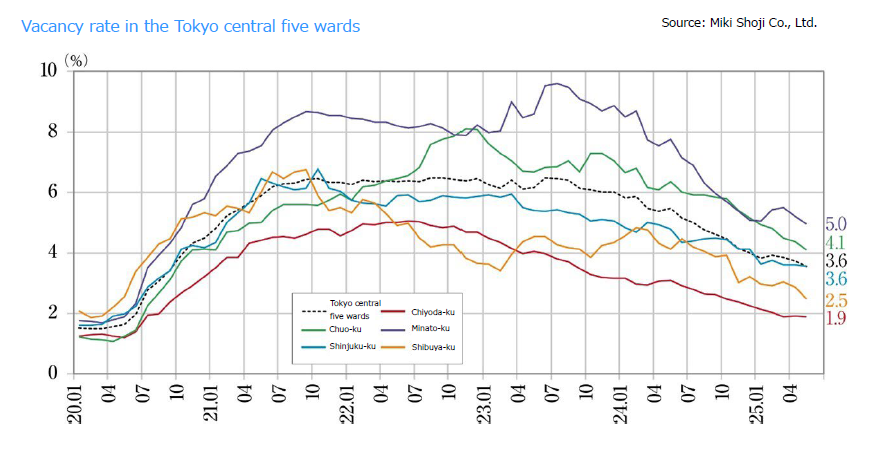
■Large-scale office buildings in Tokyo CBD (Central 5 wards)
・The vacancy rate as of May 2025 was 3.56%, down 0.17 ppt from April and below 5% since August 2024 as steady consumption of vacancies continues. Vacant floor space decreased by about 15,000 tsubo in one month.
・At JPY 20,776/tsubo, average rent was up JPY 21 MoM and up JPY 832 YoY, remaining above JPY 20,500/tsubo since March 2025, showing an upward trend.
・The vacancy rate fell MoM in all five central wards, reaching levels below 3% in Chiyoda and Shibuya. Rents also were up MoM in all wards.
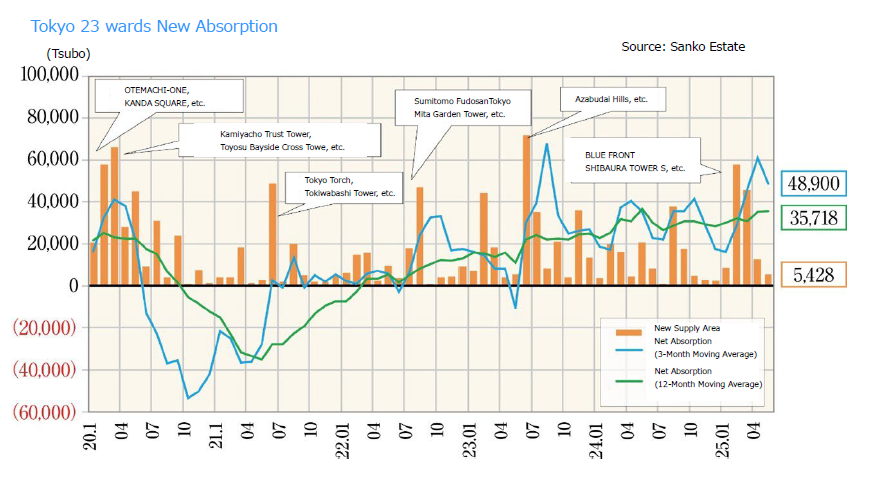
■Net absorption
・Single-month net absorption (change in office occupied floor space) in May was +24,140 tsubo in the 23 wards of Tokyo, up 5,477 tsubo YoY.
・The vacancy rate on new buildings (completed less than one year ago) is 22.96% (down 3.3 ppt MoM). The rate improved from 25.83% in the same month last year.
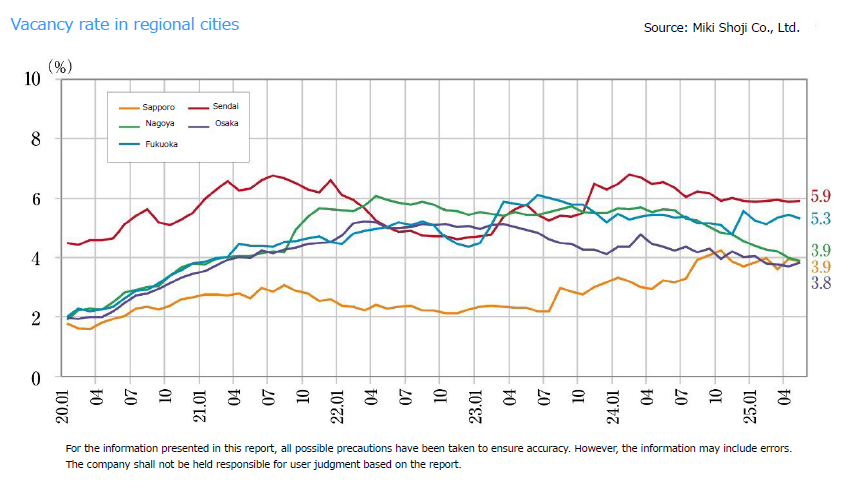
■Movement in vacancy rates and average rents in major regional cities / May 2025
・Sapporo: Vacancy @ 3.87% down 0.07 ppt MoM. Average rent @ JPY 10,891 per tsubo up JPY 26 MoM. (Vacancy rate improved slightly while the average rent improved.)
・Sendai: Vacancy @ 5.91% up 0.04 ppt MoM. Average rent @ JPY 9,437 per tsubo up JPY 14 MoM. (Vacancy rate changed little, whereas the average rent increased.)
・Yokohama: Vacancy @ 6.36% down 0.09 ppt MoM. Average rent @ JPY 13,024 per tsubo down JPY 10 MoM. (Vacancy rate improved slightly, whereas the average rent decreased slightly.)
・Nagoya: Vacancy @ 3.89% down 0.11 ppt MoM. Average rent @ JPY 12,667 per tsubo up JPY 9 MoM. (Vacancy rate improved while the average rent improved slightly.)
・Osaka: Vacancy @ 3.83% up 0.13 ppt MoM. Average rent @ JPY 12,333 per tsubo up JPY 52 MoM. (Vacancy rate increased while the average rent improved.)
・Fukuoka: Vacancy @ 5.31% down 0.12 ppt MoM. Average rent @ JPY 12,005 per tsubo up JPY 13 MoM. (Vacancy rate and average rent improved.)
The vacancy rate increased in Sendai and Osaka. Vacancy rates fell in Sapporo, Yokohama, Nagoya, and Fukuoka. Rents increased in Sapporo, Nagoya, Osaka, and Fukuoka. Overall, while the vacancy rate increased, the increase was a small one as market conditions appear to be stable.
■ Status quo and future market outlook
・In the bay area, including Tennozu, Harumi, and Toyosu, numerous office buildings are faced with persistent vacancies that they have been unable to fill since vacancy rates increased during COVID. It has been pointed out that this could lead to future gaps between demand and supply.
・There are concerns that an increase in the percentages of workers commuting to work in the office could lead to polarization between office buildings in convenient, popular locations near rail hubs and those in less popular areas.
・The new supply of medium-sized or larger office buildings (50 or more tsubo/floor) in 2025–2027 was approx. 434,000 tsubo in the five central wards of Tokyo, 40,000 tsubo in the three main wards of Osaka, 33,000 tsubo in Sapporo, 5,000 tsubo in Sendai, 41,000 tsubo in Nagoya, and 46,000 tsubo in Fukuoka. The new supply in Tokyo exceeded 450,000 tsubo in 2022–2024, and conditions of an oversupply are expected to continue in the future.
Hospitality
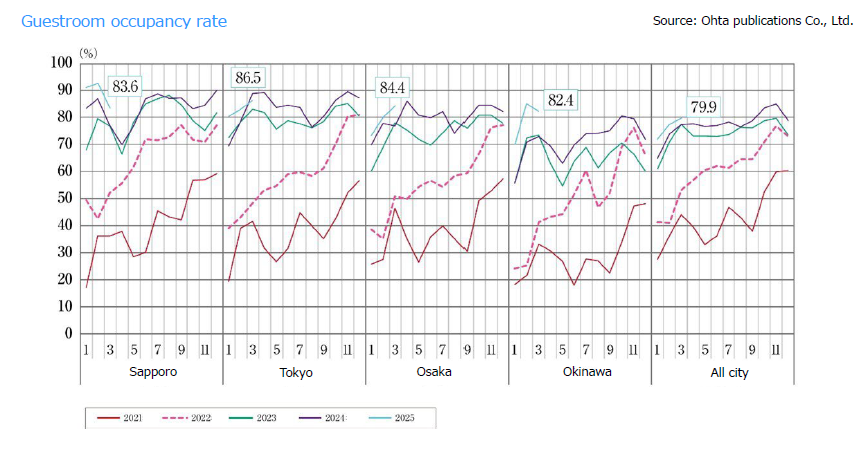
Growth in demand for accommodations from inbound guests made up for the decrease in Japanese guests, and increasing numbers of new hotels are opening in major cities and resort areas of Japan.
■Rapid growth in inbound guests drives up the number of overnight stays
・In April 2025, the total number of overnight stays in Japan was 53.36 million (up by 2.8% YoY). Of these, 16.39 million were from abroad (up 13.0% YoY), and 40.09 million were Japanese (down 3.4% YoY). While the number of Japanese guests was down, demand from inbound guests increased sharply.
■Recent trends by category
・The overall guestroom utilization rate in April 2025 was 61.7% (up 1.9% YoY). Guestroom utilization rates by type of facility were 57.4% at resort hotels, 74.8% at limited-service hotels and 74.0% at full-service hotels. Osaka had the highest guestroom utilization rate in Japan at 78.0% due in part to the impact of Expo 2025 Osaka, Kansai, Japan.
■Inbound trends
・The top countries and regions represented in total overnight stays by guests from abroad in March 2025 were China (2.106 million), the United States (1.786 million), Taiwan (1.516 million), and South Korea (1.334 million). Sharp YoY increases were apparent in stays by guests from Russia (up 78.2%), China (up 55.1%), and Indonesia (up 36.7%).
■Status quo and future market outlook
・Amid rising interest in authentic Japanese experiences, chiefly among wealthy travelers, the number of high-grade hotels is increasing. The 2025 Forbes Travel Guide awarded five stars to 13 facilities in Japan.
・At the same time, securing human resources for the long term is becoming a pressing need amid increasingly intense competition in hiring and decreasing motivation among young people to seek employment in accommodations.
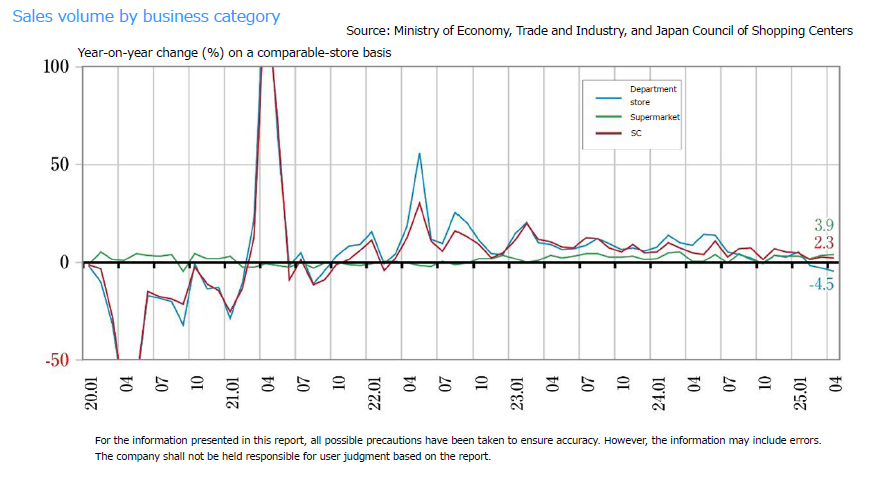
Commercial (SC)
While the number of new shopping centers opening in 2025 is expected to reach the lowest level ever, existing shopping centers continue to perform well, and developers are focusing on small-scale shopping centers to meet local shopping needs.
■Sales volume and status quo of shopping centers
・Existing store sales for shopping centers (overall) were approximately JPY 629.8 billion (up +2.3% YoY) in April 2025, showing positive growth for the 38th consecutive month. Despite difficulties in selling spring and summer apparel because of low temperatures in the first half of the month, sales were up YoY thanks to the support of other industries, such as sundries and food and beverages.
・Viewed by location, sales for shopping centers in central areas were up 3.7% YoY thanks to the effects of renovations and tenant changes as well as favorable performance by centers that attracted tourists both from Japan and abroad. In peripheral areas, shopping centers attracting inbound shoppers and participants in events from the local area showed favorable performance, up 1.7% YoY.
■Status quo and future market outlook
・Demand for seasonal items has a pronounced upward effect on sales. While lively demand is expected as a result of hot summer temperatures nationwide, increasingly extreme weather is a subject of concern.
・Growth in consumption by event attendees and in inbound tourist destinations is among factors pushing up business performance. Generating synergy effects by promoting cooperation with local governments, tourist destinations, accommodations, restaurants and bars, and other partners is becoming essential.
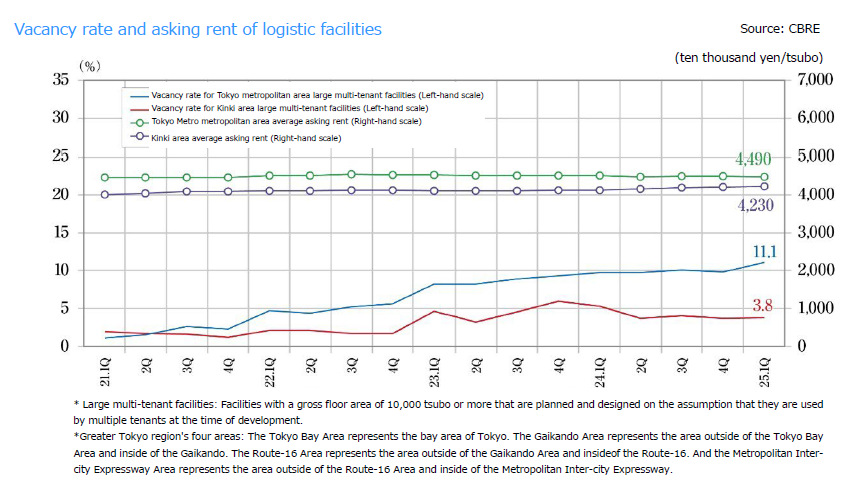
Logistics
In 2025, restrained new supply led to lower vacancy rates in the Tokyo metropolitan area market, while demand is strong in the Kinki, Chubu, and Fukuoka regions despite projected large-scale new supply.
■Market conditions in the Tokyo metropolitan area and conditions by area in 1Q 2025
・In the Tokyo Bay area, the vacancy rate was 7.3% (down 2.4 ppt YoY), and the effective rent was JPY 7,620 per tsubo (up 0.8%). Large-scale properties completed in 2023 are operating at full occupancy, and smaller spaces were filled as well.
・In the Tokyo Gaikan Expressway area, the vacancy rate was 6.1% (down 0.5 ppt), and the effective rent was JPY 5,300 per tsubo (up 0.8 ppt). Vacancies were filled in one existing property, and while some relatively newer properties continued to have vacancies, inquiries are apparent regarding future new supply.
・In the National Route 16 area, the vacancy rate was 10.5% (up 1.7 ppt), and the effective rent was JPY 4,540 per tsubo (up 0.4%). One of three new properties is full, while the other two still have substantial vacancies. While existing facilities in Kanagawa Prefecture have numerous vacancies, demand is apparent from multiple tenants, including those for properties not yet completed. Rents are increasing in Saitama and Chiba prefectures and Tokyo's Hachioji area, where vacancies are scarce; they decreased, however, in parts of Kanagawa Prefecture.
・In the Metropolitan Intercity Expressway area, the vacancy rate was 16.8% (up 2.0 ppt), and the effective rent was JPY 3,510 per tsubo (down 1.1%). All four new properties were completed in Ibaraki Prefecture, and tenants have been determined for some of their partitions. Filling of vacancies continues among multiple relatively newer properties, and even as secondary vacancies arise, new demand is much higher than in the past two years at 52,000 tsubo. However, existing vacancies exceed 300,000 tsubo because demand appears to be easing.
■Market condition in other regions
In the Kinki region: The vacancy rate was 3.8% (up 0.1 ppt YoY), and the effective rent was JPY 4,230 per tsubo (up 0.5%). Among the four new properties that came on the market, two were completed at full occupancy. Among existing properties, one completed in 2024 is operating at full occupancy, while those completed in 2023 also are making progress in filling vacancies. New demand was 102,000 tsubo. In the Kinki region as a whole, diverse demand is apparent from such industries as food products, sundries, e-commerce, and other consumer fields as well as manufacturing. Multiple LMTs are meeting this demand. Since the balance between demand and supply is tight, rents are in an increasing trend overall.
・Chubu region: The vacancy rate was 12.6% (down 0.8 ppt), and the effective rent was JPY 3,670 per tsubo (flat). Even as vacancies were filled in existing properties, a concentration of new supply in the next period is expected to push the vacancy rate up. The trend among tenants is an active one with inquiries received from non-manufacturing fields, such as sundries and food products.
・Fukuoka region: The vacancy rate was 4.2% (down 0.9 ppt), and the effective rent was JPY 3,570 per tsubo (up 0.8%). One new property was completed with more than 80% occupancy, and one relatively newer large-scale property has largely filled its vacancies. New demand in this period was 19,000 tsubo.
■Future market outlook
・New supplies of space projected in 2Q 2025 through 1Q 2026 are approximately 430,000 tsubo in the Tokyo metropolitan area, 340,000 tsubo in the Kinki region, slightly less than 240,000 tsubo in the Chubu region, and about 70,000 tsubo in the Fukuoka region.
・ Six quarters during the past two years saw a new supply of 150,000 tsubo or more in the Tokyo metropolitan area, where a new supply in 1Q 2025 was also high at more than 200,000 tsubo. Areas with considerable vacancies, including the Metropolitan Intercity Expressway area, are faced with oversupply and a pressing need to fill vacancies.
・The Fukuoka region is attracting attention for its demand from diverse industries and numerous entries by infrastructure firms. For example, Kyushu Electric Power and JR Kyushu have announced planned new supplies.
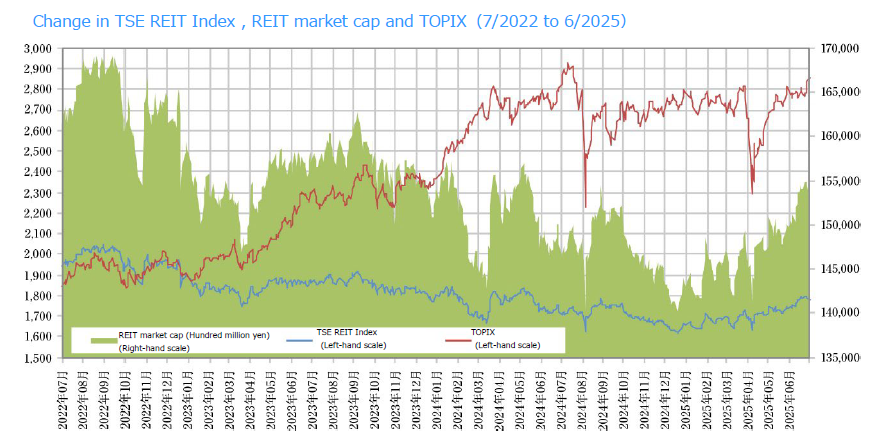
J-Reit
US tariff policies have strongly impacted the index, while favorable office and residential rent conditions are having positive impacts.
■J-Reit market trend
・UAt the end of June 2025, the Tokyo Stock Exchange Reit Index closed at 1,778.87 pts, up 7.62% from the end of FY 2024. Aggregate total J-REIT market capitalization was JPY 15.3279 trillion, up 7.23% over the same period. This performance greatly exceeded that of TOPIX, which rose by just 2.44% during the same period. The stock market fell sharply in early April because of concerns about the Trump administration's tariff policies in the United States. The TSE Reit Index also fell to its lowest point since the start of the year, but it soon recovered to the 1,700 pt level and has shown a general recovering trend since.
・Contributing factors include lower long-term interest rates in the United States due to concerns about an economic downturn, reduced expectations for interest-rate hikes by the BoJ, an increasing trend in dividends as management strategies conscious of the cost of capital permeate among REITs, and favorable REIT performance as office and residential rents show clear increasing trends.
・The aggregate AUM of J-REITs as a whole grew by JPY 159.7 billion from 2024 year-end to JPY 23.785 trillion as of the end of May. AUM increased for hotel, logistics, and residential J-REITs and decreased for office and retail J-REITs.
■Status quo
・Only three J-REITs announced POs in H1 2025: Tokaido REIT, Inc., Heiwa Real Estate REIT, Inc., and Nippon Building Fund Inc. This was down sharply from the number of nine last year. At the same time, the number announcing buybacks of investment units was up sharply to sixteen from seven last year.
・While it is difficult to conduct POs because of the lengthy slump in investment unit market prices since last year, capital policies are shifting toward a strategy of increasing returns to investors through such means as distributing gains on the sale of properties and investment unit buybacks using the proceeds from the said sale.


お問い合わせ Contact us
まずは、お気軽にご相談ください。