

Quarterly Report for Premium Condominiums in Tokyo | 4Q FY 2024

【Chart 1】
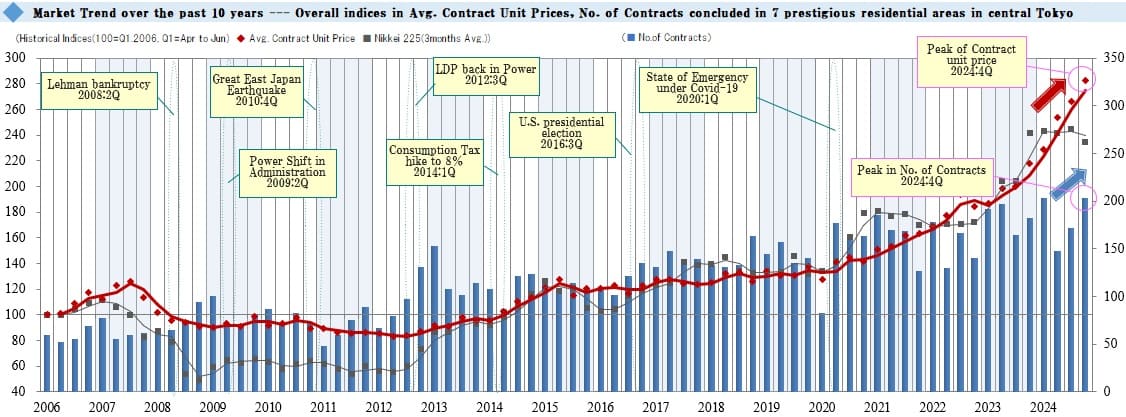
This graph shows an index of changes in average contract price per tsubo (*Notes: 1. Indexation using average contract price per tsubo in 1Q / FY 2006 as 100. 2. Tsubo is a Japanese traditional unit of area equal to approx. 3.31sqm.) and the number of contracts concluded every quarter for premium condo. units in 7 prestigious areas of central Tokyo.
Major economic events and Nikkei Stock Average are also shown for reference. The bar graph represents the number of contracts concluded each quarter. The red-line shows a movement in the index of average contract price per tsubo, while the gray-line shows one in the Nikkei stock average.
In the 4th quarter reviewed here (2024: 4Q), the index of the average contract price per tsubo for premium condominium units sold (above) rose by +16.2 points QoQ to 282.9, setting a new record since the beginning of data collection for the seventh consecutive quarter. The number of contracts made was up by 30 QoQ to 203, rising for the second consecutive quarter to equal the record since the beginning of data collection, which it had reached in 2024: 1Q.
【Chart 2】
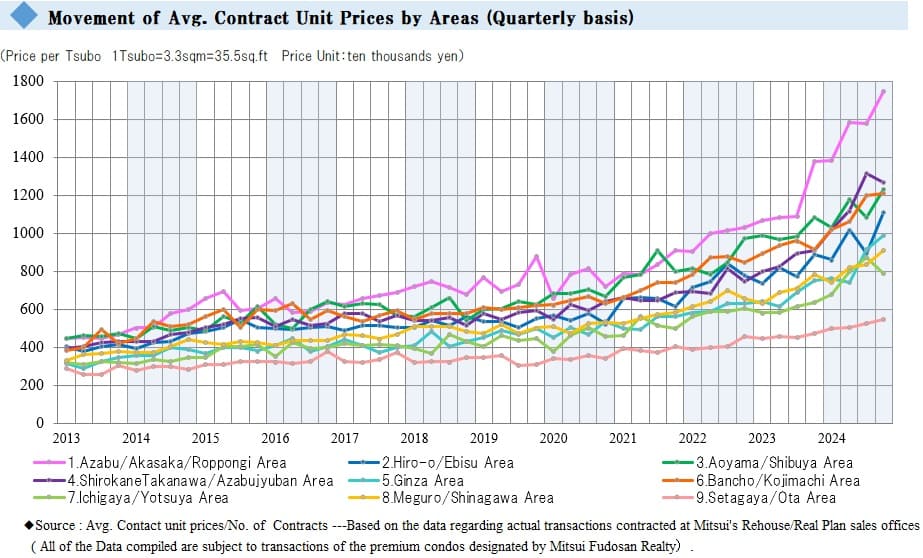

The chart above shows the trend in the average contract price per tsubo by area.
There were increases in all seven areas other than the two areas of the “Shirogane Takanawa / Azabujuban Area” and the “Ichigaya / Yotsuya Area,” where the average contract price decreased this quarter. Each of the seven areas went up to a record historical high since the beginning of data collection. Especially in the cases of the “Bancho / Kojimachi / Iidabashi Area” and the “Setagaya / Ota Area,” this was the fourth and fifth consecutive time to hit a record high, respectively.
【Chart 3】
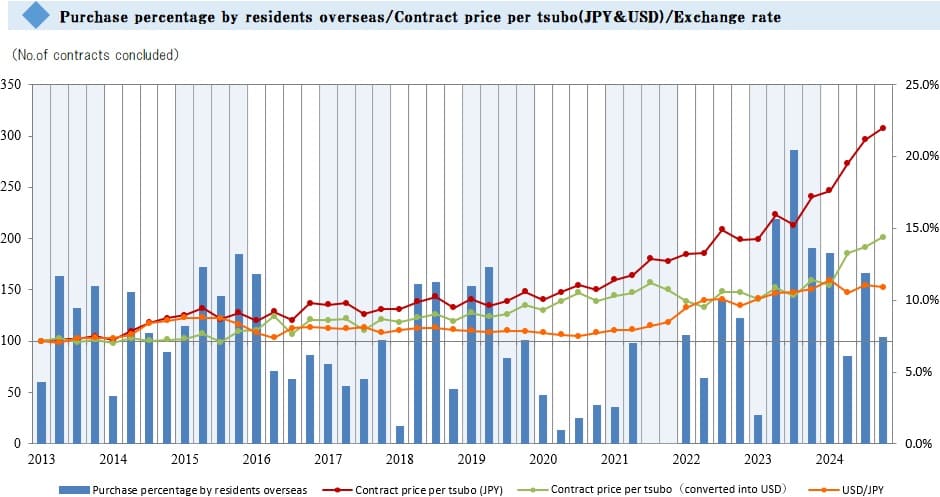
The chart above shows the percentage of purchases by overseas residents among Mitsui Fudosan Realty Group transactions and their average contract prices per tsubo (JPY and USD) compared to the exchange rates.
The percentage of purchases by overseas residents fell by 4.4 ppt QoQ in this quarter, to 7.4%. The average price per tsubo this quarter (converted to USD) was up by $3,888 QoQ to $79,453. For the third consecutive quarter, this is the highest USD price per tsubo since the beginning of data collection, an indicator of the effect of the recent increase in the value of the yen.
The number of contracts increased for the second consecutive time this quarter, and the average price per tsubo set a new record high for the seventh consecutive quarter. The inventory for all nine areas combined as of the end of this quarter was 742, up QoQ for the third consecutive quarter, by +32%. It will be worthwhile to note how this inventory will affect the number of contracts and the average price per tsubo in the ensuing quarters. It will be prudent to keep a close watch on the market impact of large-scale developments reaching completion soon along with trends in the Nikkei Average, exchange rates, the global situation, and inbound demand in the coming quarters.


お問い合わせ Contact us
まずは、お気軽にご相談ください。